Here are a few rough notes documenting NodeeditorPlus, which could be added to the Documentation pdf.
I find it very difficult to write understandable documentation, and so tend to write in a verbose manner.
NodeeditorPlus documentation (rough notes 1/2/2025):
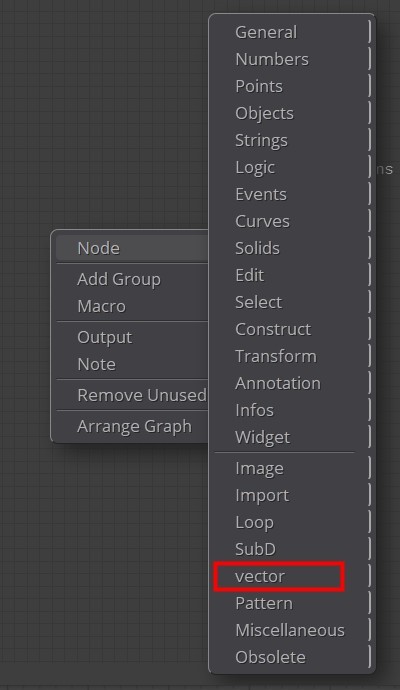
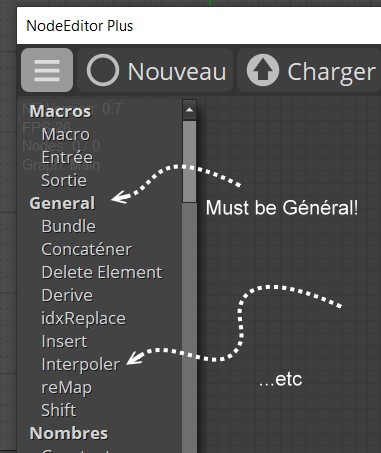
The General submenu is a collection of Multitype nodes.
The 4 types are described in MO's documentation pdf.
Input data is combined by Bundle node, or Concat node. The node is set to one of the four Types, (modes).
Each input slot receives data that is an array of elements corresponding to the mode.
Many input slots may be added to these nodes.
The difference between the Output of these two nodes is describe as follows:
In pointarray mode, the difference between Bundle and Concat is in the order in which the inputs are combined in the Output.
Concat (concatenate) takes a pointarray (input1), and adds (appends) a second pointarray (input2), and places the combined array into the output. (Additional inputs are also appended.)
Bundle takes the first point of the first pointarray (input1) and then the first point of the second pointarray (input2) and places them into the output array - and so on. So you can create e.g. points on different curves, bundle them and draw new curves across the base curves. (abstracted from Karsten, 2019)
An alternate explanation, considers the input data to be in a spreadsheet or matrix layout, where each cell contains an Element. Each node input is a "Row" array of Elements.
Concat outputs row1, followed by row2, ..., rowLast. This output is a concatenated array.
Bundle outputs the "Columns" (slices). row1_Element1, row2_Element1, ..., rowLast_Element1, then row1_Element2, row2_Element2, ..., rowLast_Element2,then, ...row1_LastElement, row2_LastElement,..., rowLast_LastElement. The output is an array.
Documentation on the Notes node:
Ctrl+Enter Set the text entries, or else they disappear.
Notes node can also be used as a title to the node assemblage, and brief documentation.
Text node can have text of point coordinates typed in, and then the node will output the point data.
For example, for x1 = 0.00, y1 = 0.39, z1 = -0.20, for the first row, type in 0.00 0.39 -0.20,
In the following pattern (do NOT type the text xi yi zi):
x1 y1 z1
x2 y2 z2
x3 y3 z3
etc
The pointarray output can be fed to the Interpolate node and/or the ConvertPts node, to display points, interpolated points, or curves.
Add another canvas:
Alt+New
- Brian
ps
I did some testing of the swRotary node, in 3 of the modes.
It appears to function well.
I did manage to lock up the swRotary node, (somehow), in pointarray node, when only one input was hooked up, with switch set to a blank input.
|