Here is a script to plot the 2D graphs of functions on the fly.
You can use all functions and constants of the Javascript Math object:
code:
abs(x)     Returns the absolute value of x
acos(x)    Returns the arccosine of x, in radians
asin(x)    Returns the arcsine of x, in radians
atan(x)    Returns the arctangent of x as a numeric value between -PI/2 and PI/2 radians
ceil(x)    Returns x, rounded upwards to the nearest integer
cos(x)     Returns the cosine of x (x is in radians)
exp(x)     Returns the value of Ex
floor(x)   Returns x, rounded downwards to the nearest integer
log(x)     Returns the natural logarithm (base E) of x
pow(x,n)   Returns the value of x to the power of n
random()   Returns a random number between 0 and 1
round(x)   Rounds x to the nearest integer
sin(x)     Returns the sine of x (x is in radians)
sqrt(x)    Returns the square root of x
tan(x)     Returns the tangent of an angle

E          Returns Euler's number (approx. 2.718)
LN2        Returns the natural logarithm of 2 (approx. 0.693)
LN10       Returns the natural logarithm of 10 (approx. 2.302)
LOG2E      Returns the base-2 logarithm of E (approx. 1.442)
LOG10E     Returns the base-10 logarithm of E (approx. 0.434)
PI         Returns PI (approx. 3.14)
SQRT1_2    Returns the square root of 1/2 (approx. 0.707)
SQRT2      Returns the square root of 2 (approx. 1.414)
If you want to use degrees instead of radians - use square brackets. sin(x) <- x in radians, sin[x] - x in degrees.
You can use "rnd" command instead of random() function
Other settings:
minX, maxX - limits of the function. Don't forget, in MoI you can use math expression in the settings.
Example: y=sin(x), minX = 0, maxX = 2*pi <- you will get one full period of sine function
points - number of points. If 500 points is not enough, you can set any other value manually.
Update:
v.1.1
- Some optimizations
- [Added] Variables (a,b,c,d)
v.1.2
- [Fixed] Unexpected condition error (I hope so)
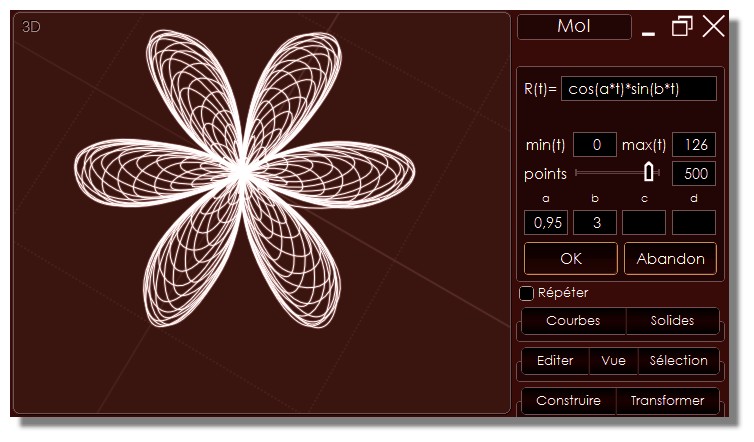
- [Added] Radial mode (if script detects "t" variable in the formula, it automatically switches to R(t) mode)
- [Added] Command line arguments
Usage: "_fxGraph fx;min;max;points;a;b;c;d"
Examples:
_fxGraph sin(x) -> f(x)=sin(x)
_fxGraph sqrt(x);0;25 -> f(x)=sqrt(x), min(x)=0, max(x)=25
_fxGraph pow(x,a);;;;3 -> f(x)=pow(x,a), a=3
v1.2c
-[Added] Copy settings to clipboard by clicking f(x)/R(t) symbol. You can use this string as command line argument.
v1.2d
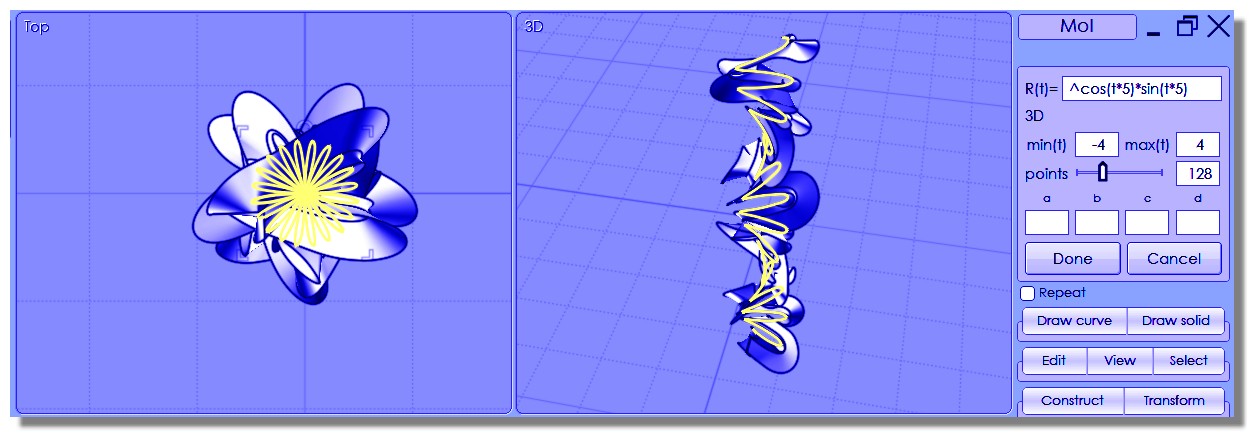
- [Added] R(t)3D mode. Add ^ symbol at the beginning of a R(t) formula to draw 3D graph.


3D.jpg)