Show messages:
1-20
21-40
41-60
61-80
81-91
From: Max Smirnov (SMIRNOV)
Here is a script to plot the 2D graphs of functions on the fly.
You can use all functions and constants of the Javascript Math object:
code:
abs(x)     Returns the absolute value of x
acos(x)    Returns the arccosine of x, in radians
asin(x)    Returns the arcsine of x, in radians
atan(x)    Returns the arctangent of x as a numeric value between -PI/2 and PI/2 radians
ceil(x)    Returns x, rounded upwards to the nearest integer
cos(x)     Returns the cosine of x (x is in radians)
exp(x)     Returns the value of Ex
floor(x)   Returns x, rounded downwards to the nearest integer
log(x)     Returns the natural logarithm (base E) of x
pow(x,n)   Returns the value of x to the power of n
random()   Returns a random number between 0 and 1
round(x)   Rounds x to the nearest integer
sin(x)     Returns the sine of x (x is in radians)
sqrt(x)    Returns the square root of x
tan(x)     Returns the tangent of an angle

E          Returns Euler's number (approx. 2.718)
LN2        Returns the natural logarithm of 2 (approx. 0.693)
LN10       Returns the natural logarithm of 10 (approx. 2.302)
LOG2E      Returns the base-2 logarithm of E (approx. 1.442)
LOG10E     Returns the base-10 logarithm of E (approx. 0.434)
PI         Returns PI (approx. 3.14)
SQRT1_2    Returns the square root of 1/2 (approx. 0.707)
SQRT2      Returns the square root of 2 (approx. 1.414)
If you want to use degrees instead of radians - use square brackets. sin(x) <- x in radians, sin[x] - x in degrees.
You can use "rnd" command instead of random() function
Other settings:
minX, maxX - limits of the function. Don't forget, in MoI you can use math expression in the settings.
Example: y=sin(x), minX = 0, maxX = 2*pi <- you will get one full period of sine function
points - number of points. If 500 points is not enough, you can set any other value manually.
Update:
v.1.1
- Some optimizations
- [Added] Variables (a,b,c,d)
v.1.2
- [Fixed] Unexpected condition error (I hope so)
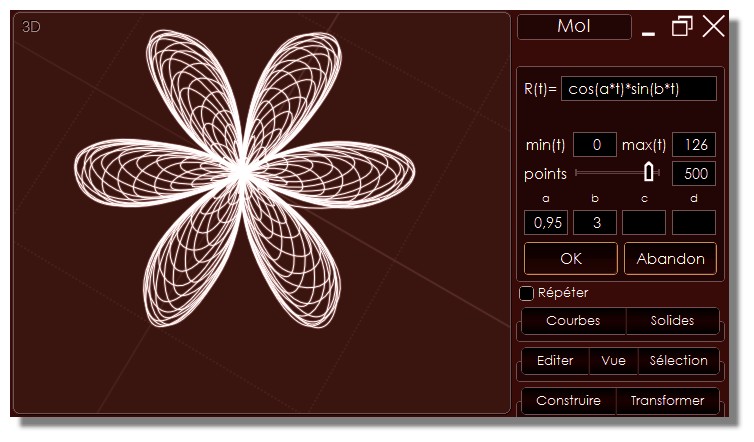
- [Added] Radial mode (if script detects "t" variable in the formula, it automatically switches to R(t) mode)
- [Added] Command line arguments
Usage: "_fxGraph fx;min;max;points;a;b;c;d"
Examples:
_fxGraph sin(x) -> f(x)=sin(x)
_fxGraph sqrt(x);0;25 -> f(x)=sqrt(x), min(x)=0, max(x)=25
_fxGraph pow(x,a);;;;3 -> f(x)=pow(x,a), a=3
v1.2c
-[Added] Copy settings to clipboard by clicking f(x)/R(t) symbol. You can use this string as command line argument.
v1.2d
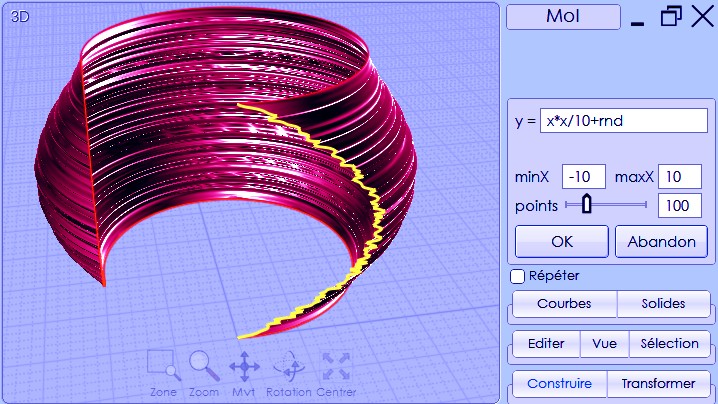
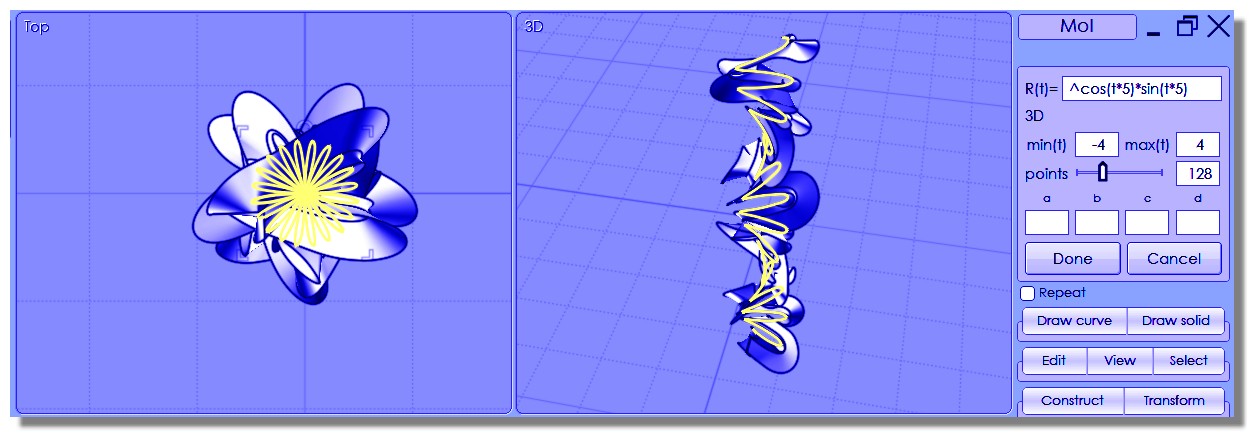
- [Added] R(t)3D mode. Add ^ symbol at the beginning of a R(t) formula to draw 3D graph.
From: Frenchy Pilou (PILOU)
Excellent!
Useful for math lovers! :)
Waiting the 3D! ;)
From: bemfarmer
Superb script MAX !
Just assigned it to my SHIFT+F shortcut.
This script replaces a bunch of one-shot scripts.
It can create an unbounded number of curves.
It uses the fast method of scripting mostly in .htm file.
Other math functions could be added. Maybe for a catenary? Have to investigate the math, it uses hyperbolic trig, or exponentials.
? If a version were created for a U parameter, nested with a V parameter, it might do 3d curves ?
Do not know if it would do integration or differentiation? i.e Euler spiral?
- Brian
From: bemfarmer
exp(x) give an "unknown command" error.
Edit: pow(x,2) works. (n needs to be a number:-), (pow(x,n) is not a correct entry)
log(x) works for minX = 0
- Brian
From: Max Smirnov (SMIRNOV)
Thank you! :)
Frenchy Pilou (PILOU)
>> Waiting the 3D!
Not now. It was in the beta version of this script, but I haven't finished it.
Brian
>> exp(x) give an "unknown command" error
fixed
>>pow(x,2) works
pow(2,x) and pow(x,x) also works perfectly
>> log(x) works for minX = 0
I set "x=minx+1/10e8" because of "Unexpected condition error" with y=1/x function. For example, y=x/0 correctly works (infinity message appears). I don't know why..
>>If a version were created for a U parameter, nested with a V parameter, it might do 3d curves ?
Yes, I think so.
From: bemfarmer
Thankyou Max
Formula for a catenary: y = 2 * (exp(x/2) + exp(-x/2))/2
A more general formula is avalue * (exp(x/avlaue) + exp(-x/avalue))/2
But in this case, avalue is just a scaling factor, so by using Scaling in MoI, the avalue is changeable.
For example doing a Scaling of 4, on a pre-created catenary, changes the avalue=2 to avalue = 8.
It might be nice to have a few parameters like avalue, bvalue ... ?
I should have referred to using U and V as creating a series of 3d curves which might be loft-able to a surface or solid.
- Brian
From: bemfarmer
Tried out version 1.1 a little. Looks good.
I suspect a version depending upon a rotational parameter t or theta,
with x = some function of t,
and y = some function of t,
would be possible?
- Brian
From: Frenchy Pilou (PILOU)
<<< y=x/0 correctly works (infinity message appears)
Seems normal, no ? ;)
If the language has not an automatically barrier for impossible operation!
From: Max Smirnov (SMIRNOV)
The script has been updated with a new R(t) function.
xy(t) is possible. I'll think about it.
From: Frenchy Pilou (PILOU)
Tricky the fact to use variables!
From: Michael Gibson
This is really cool Max, to have a more general purpose curve constructor that can be used for a lot of different possible formulas!
- Michael
From: wastzzz
Epic, funny and useful! Thank you.
From: Max Smirnov (SMIRNOV)
v1.2d
- [Added] R(t)3D mode. Add ^ symbol at the beginning of a R(t) formula to draw 3D graph.
^pow(t,a)/pow(10,2*a-2);-100;100;500;3
3D.jpg)
From: Frenchy Pilou (PILOU)
Born of the 3D world! ;)
From: Max Smirnov (SMIRNOV)
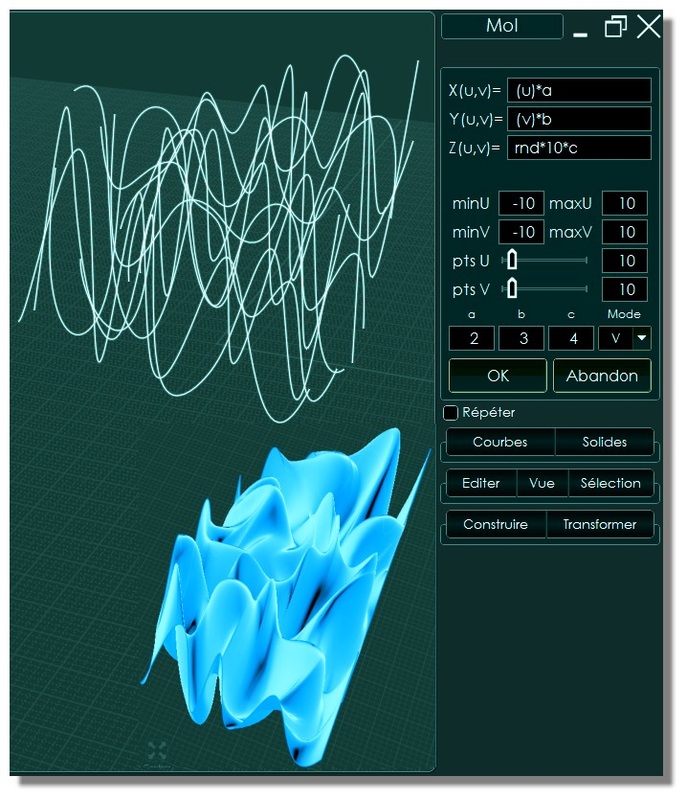
This is my new script - FxGraph3D which allows drawing 3D parametric surfaces.
x = X(u,v), y = Y(u,v), z = Z(u,v), where u,v are the parametric domain parameters.


Here is some interesting parametric equations.
http://msenux.redwoods.edu/Math4Textbook/Plotting/ParametricSurfaces.pdf
From: Michael Gibson
Very cool Max!
- Michael
From: wastzzz
Thank you!
From: Max Smirnov (SMIRNOV)
Version 1.0
Changes since 0.6:
[fixed] some bugs
[added] Command line parameters support. Click X(u,v), Y(u,v) or Z(u,v) label to copy values to the clipboard.
Examples:
_FxGraph3D (u);(v);rnd;-10;10;-10;10;10;15;;;;U
_FxGraph3D u*a+rnd-0.5;v*b+rnd-0.5;rnd*c-c/2;-10;10;-10;10;50;50;2;2;40;P
_FxGraph3D 2*(1-exp(u/(6*pi)))*cos(u)*cos(v/2)*cos(v/2);2*(-1+exp(u/(6*pi)))*sin(u)*cos(v/2)*cos(v/2);1-exp(u/(3*pi))-sin(v)+exp(u/(6*pi))*sin(v);0;20;0;6.283185307179586;50;50;;;;V
_FxGraph3D (2+v*sin(u))*sin(2*pi*v);v*cos(u);(2+v*sin(u))*cos(2*pi*v)+2*v-v;0;3.14;0;1.3;50;50;;;;V
_FxGraph3D sin(u);cos(u);u*u/300;0;60;0;1.3;100;0;;;;V
Michael, Thank you!
From: jotero (TOROLF)
Hello all :)
It's nice and what do do with the curves?
X():cos(2*u)*cos(v) + 1.0 *cos(u)
Y():sin(v)
Z():-sin(2*u)*cos(v) + 1.0*sin(u)
[u]:0, 2*pi
[v]:0, 2*pi
And how do I get now to my mathematical NURBS model...?
http://imaginary.org/gallery/k3dsurf
Cu
Torolf
From: Frenchy Pilou (PILOU)
Cool!
French version ; )
http://moiscript.weebly.com/fx-graph-3d.html
Show messages:
1-20
21-40
41-60
61-80
81-91