Show messages:
1-7
…
108-127
128-147
148-167
168-187
188-207
208-227
228-247
…
488-503
From: bemfarmer
Great James!
Points node and MathPts node are similar.
PointArrays are output for each node.
MathPts permits the X, Y, and Z coordinates to be mathematically manipulated with parameters a, b, c and d, as denoted by pink f(u,v) output.
Write in your desired javascript mathematical formula. <<< add in examples with a,b,c,d,u,v>>>
X, Y, and Z appear in the Info window, and are the multiple point coordinates for each point of the output f(u,v) pointarray.
The MathPts node has A, B, C and D inputs available, by Right-Click on the node, click Input, and select next slot letter.
To remove the lowest existing slot, (assume it to be “b”), right click on b’s Dot, and select "Remove Slot".
A = a, B = b, C = c, and D = d. (the capitalization has no significance?).
MathPts seems to be "missing" the W range (~Z). (There must be some reason for "missing" W range?)
Sequentiually, u takes on the values of U range, v takes on the values of V range.
Points node has the W range available (~Z), as well as W num.
U num is the number of points between U range min (currently 0), and U range max (currently 10), inclusive, and becomes (part of) the X coordinate(s) of the point(s).
Similarly for V num (~Y) and for Points node, W num (~Z).
<<< examples>>>
Wiring the output f(u,v) to the input of the ConvertPts node yields 3 modes of output, Curves U, Curves V, or points.
- Brian
Local UV coordinates can be on a surface which could curve into 3d space.
The U, V, and W coordinates parallel the relative directions of X, Y, and Z coordinates. If you look at a 2D map image, U is the equivalent of X, and represents the horizontal direction of the map. V is the equivalent of Y, and represents the vertical direction of the map. W is the equivalent of Z and represents a direction perpendicular to the UV plane of the map.
A W coordinate for a 2D surface could be used to flip the orientation...
(The two nodes evolved from one or two of Max's scripts.)
From: Apophis
Pilou Du bist der Wahnsinn.
Vielen Dank für Deine Mühen. :-)
From: Frenchy Pilou (PILOU)
@Apophis
Yes totally crazzy but absolutly necessary if like me you want have any chance to make something with it when you come from the moon! :)
From: Frenchy Pilou (PILOU)
Thx to James but some headaches for adapt its advice at any volumes! :)
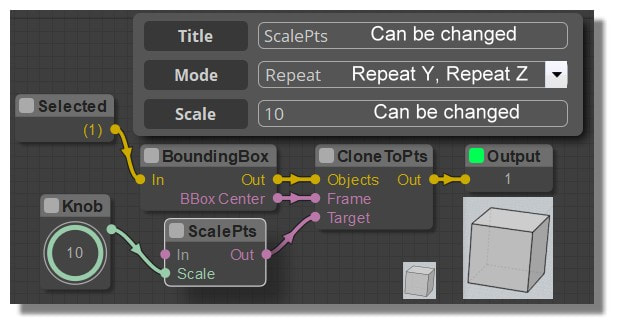
(give a specific place to the new resized element : here its Bounding box ...
better than nothing but wanted a more specific one like a same x,y,z for same start / target Pt's element !
...and what is Mode Repeat, RepeatY, RepeatZ ?
ScalePts node (English French)
http://moiscript.weebly.com/points-e.html
From: James (JFH)
Pilou,
It is not clear to me what you mean, but cloneToPts node would generally be used with multiple points.
Attached is a better example of its use. ScalePts is multiprocessing values between 1 - 2 relative to distance from origin shown in red, to points in an array.
(Note: that my "PointArray" node is the same as your "Points" node; I changed the title in the code because I think it is a more appropriate description and less similar to "Point". It will still load OK in NE)
Hope that makes it clearer.
James
https://www.instagram.com/nodeology/

Attachments:
 scalePts.nod
Image Attachments:
scalePts.gif
From: bemfarmer
So MathPts can make a u,v network of a surface in 3d space by feeding its output into two ConvertPts, one with Curve U output, and one with Curve V output,
based upon a mathematical formula with Javascript math, which includes typical math such as sines, cosines, *, +, etc.
Feeding Curve U and Curve V into a network should make a surface.
- Brian
From: bemfarmer
James, your light color scheme look very good. Will you be making it available?
- Brian
From: James (JFH)
Brian
I'm glad you like my NE mod UI. I find it more legible.
I have attached my nodeEditor folder. It also includes my alterations to node labelling and titling of many of the nodes for logical consistency and removal of redundant info. This does not in any way impact on the operation of NE, or the opening & running of existing .nod files; it is purely cosmetic. Nevertheless clarity & consistency are, IMHO paramount UI/UX considerations.
I encourage you to give it a go....however if you only want to change the colour scheme, just replace main.js & colors.js in the core folder.
Have a great weekend
James
https://www.instagram.com/nodeology/Attachments:
nodeeditor.zip
From: bemfarmer
Thank you James, your colors now replace the "dark" theme.
The previous "light" theme is also still available with appropriate alternate hotkeys.
- Brian
From: Frenchy Pilou (PILOU)
@James ...something like this! Target of the scaled volume(s) has the same x,y,z than the start one!
because all your examples used a figure who have yet a "center" inside their definitions so more easy to manage! :)
There is not such thing inside a simple complex volume(s) selection except maybe the Bounding Box...but I wish a specific x,y,z point :)
(maybe your last example will give me some ideas ...
Maybe JitterPts Node who has a Scale item inside can also make something...
other thing : Why colors of links have changed in your new personnal design UI of Node Editor?
@Bem ... yes i see the theory but can you put a little example with the nodes Math concretely for see how input formula in a Math node! :)
From: Frenchy Pilou (PILOU)
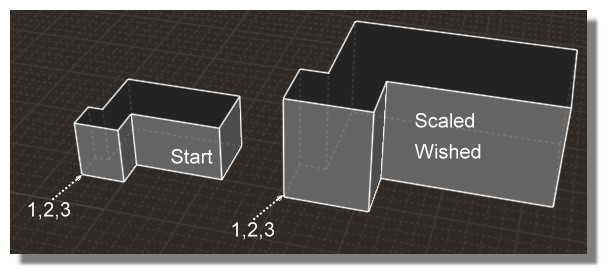
Ok find my wished Scale! :)
Start Object is selected at the good X,Y,Z position! (1,2,3)
The trick was to put 1,2,3 inside the Node Point (but even seem the "Frame" works only with 2 x,y positions ? )
and 1,2,3 inside the Move Node! :)
so some relatively easy :)
From: James (JFH)
Pilou
Alternatively use objects2/scaleUVW. See below
James
https://www.instagram.com/nodeology/

Image Attachments:
scaleUVW.gif
From: Frenchy Pilou (PILOU)
@ James Yep ...but I am for the moment only on the Native Nodes! :)
Your help will be of course needed for the extention Nodes...when I will finished the Native part!
From: Frenchy Pilou (PILOU)
"Out" of JitterPts seems gives bad link...
From: Frenchy Pilou (PILOU)
Finally found JitterPts and the scale inside! :)
JitterPts Node (English french)
http://moiscript.weebly.com/points-e.html
Now have one Star figure on the screen during the animation is another story...
surelly restrain the Array Point...Yes it is! :)
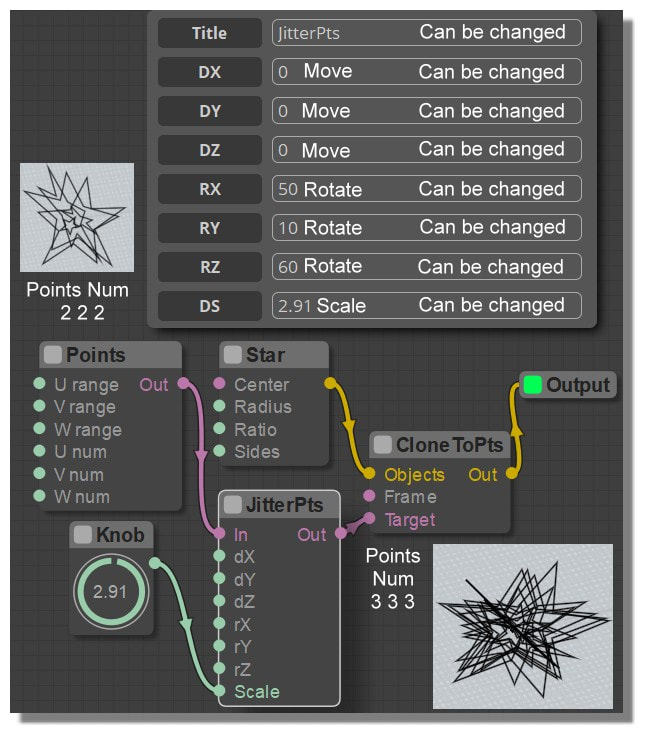
From: Frenchy Pilou (PILOU)
Less esoteric example of the CloneToPts node :)
From: Frenchy Pilou (PILOU)
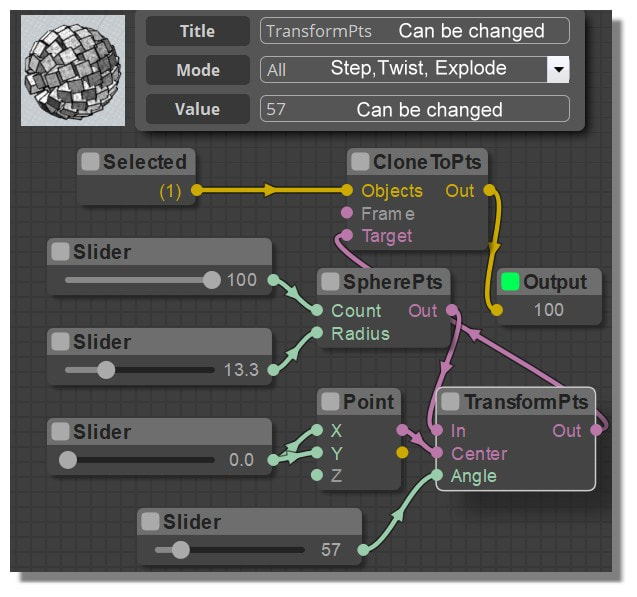
TransformPts Node (English French) rest MathPts in this section! :)
http://moiscript.weebly.com/points-e.html
From: Frenchy Pilou (PILOU)
More precision about TextPts Node (Don't know if there are more than 6 parameters ?
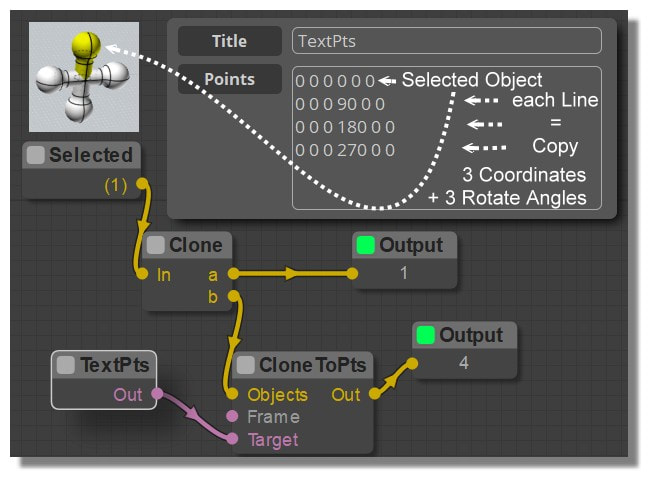
From: Frenchy Pilou (PILOU)
If for the normal Math Node I can understand where put some formulas, I am more perplex for the MathPts Node! :)

I need some examples for unblock the situation! :)
From: bemfarmer
Hi Pilou,
The X, Y, and Z can be functions of u and v.
So X = sin(u) would be one example. Y = cos(v), Z = sqrt(something)...
Or more complex equations.
Check out the Macro's, which are likely from James:
mobius, offsetGrid, sineSurf, waveSurf, quadSpheres.
It would be nice to find a really cool example.
Maybe a curvy surface in 3d...
- Brian
Show messages:
1-7
…
108-127
128-147
148-167
168-187
188-207
208-227
228-247
…
488-503